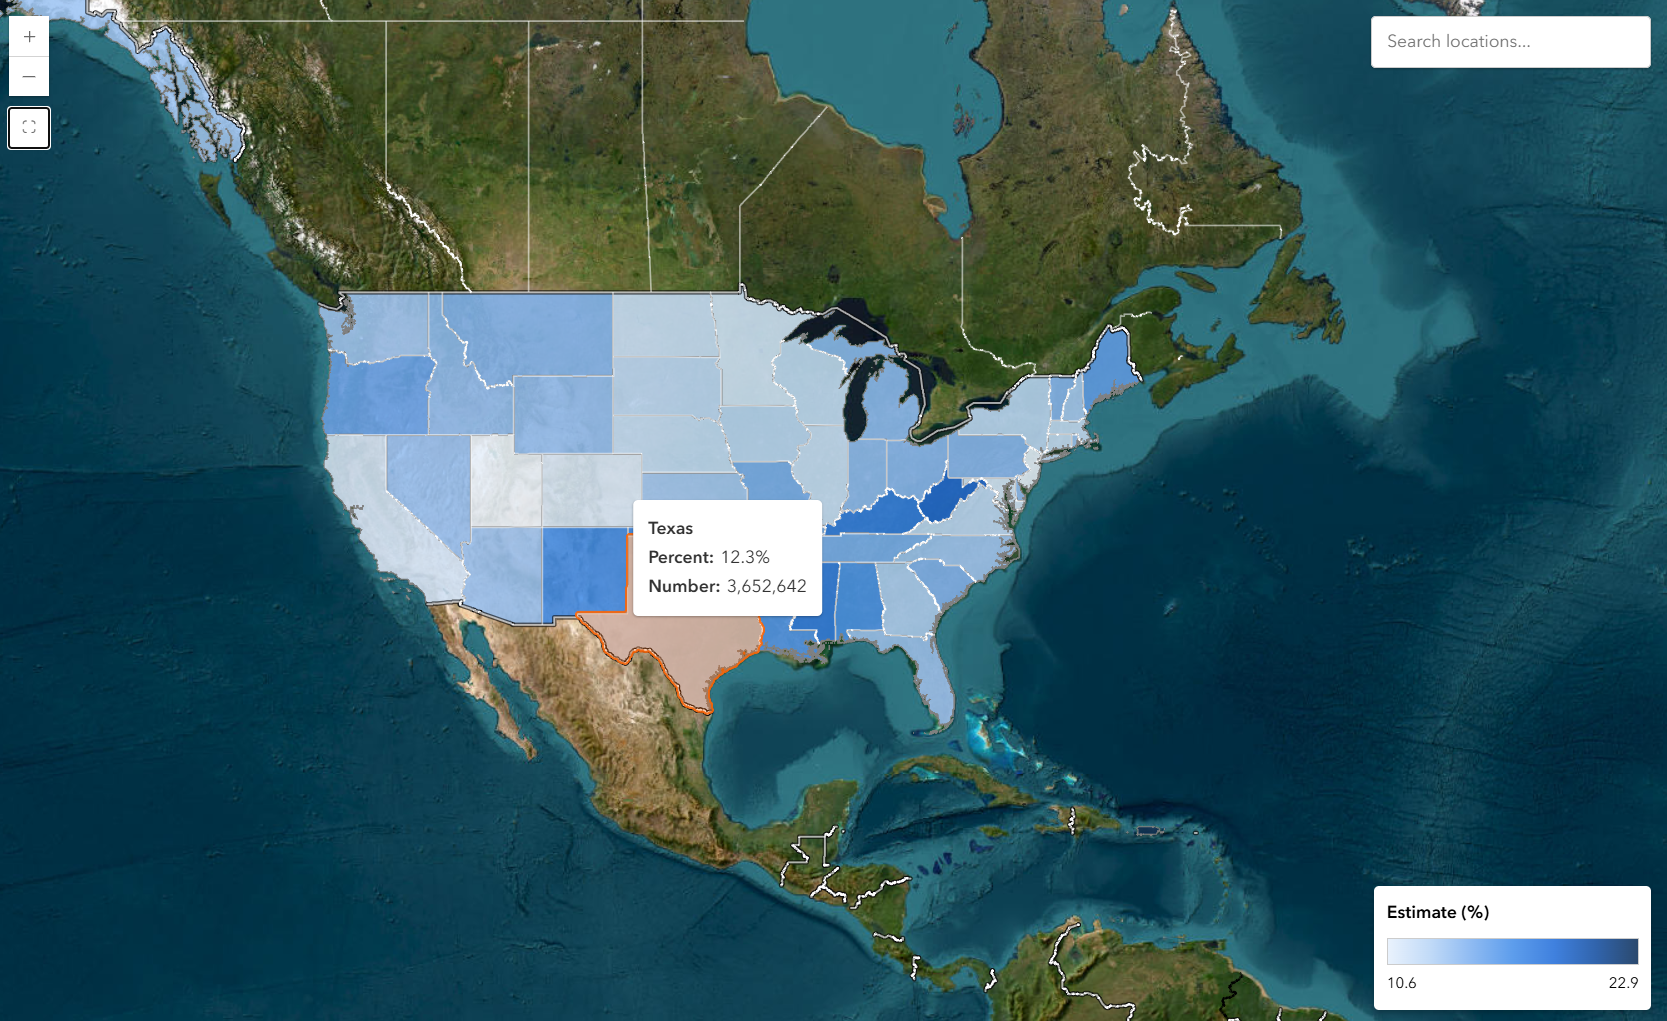
A visual produced by Disabilitystatistics.org.
In a political moment where data surrounding health and disability can draw suspicion—as the Trump administration continues to erode public trust— finding solid disability-based data in an accessible format feels like discovering an oasis in the middle of a desert.
There are multiple large-scale research projects that journalists and interested members of the public can draw from. However, one of the easiest to use is a site published by the Northeast ADA Center (which is housed within Cornell University’s Yang-Tan Institute on Employment and Disability) called Disabilitystatistics.org. Started more than 20 years ago, the project is one of the few that offers accessible disability-related data that can be easily visualized into charts and graphs without having to fall down rabbit holes filled with drop down menus and inaccessible interfaces. The site was relaunched in 2025.
Bill Erickson is a senior research specialist at the institute and leads much of the data crunching effort. He says data the site provides is often buried on other websites, making it difficult to use properly and that you need good data to create better outcomes.
“To make good decisions, you need good data, right? And if data does become unavailable, then you’re making decisions based on whatever and that’s obviously a massive issue. So, what we try to do is provide data and information as up to date as possible based on the best data sources we have available,” Erickson says.
Erickson says he hasn’t faced any large-scale data collation issues recently, but that there have been “hiccups.” The site takes data from the American Community Survey, which is conducted yearly, and drills down based on parameters that include geographical region, race, and type of disability. For some aspects of the data, users can get as granular as county-level data and have the results visualized as a chart or a map. There is also a frequently asked questions section that tackles intricacies like different U.S. agencies’ differing definitions of disability and how they affect data collection.
Camille Lee is the institute’s manager of web and image. She says that making this data accessible is an ongoing effort to reach more than the people affectionately known as policy wonks and support everyone from business leaders to advocates, hiring managers and healthcare providers.
“We want to make this data more and more available and more and more usable because the more it’s used, then the more clearly we can articulate its need to exist,” she says.
Lee and Erickson say that they’ve been told their data is used by congressional staffers and leaders in policy development across the political spectrum. Lee sees that as gratifying proof that their work is filling a much-maligned gap.
“A part of what I want to do is make sure that we have a fantastic outlet for what the government is doing. The Census Bureau can’t do everything. They do great work, but the U.S. Census Bureau can’t serve everybody all the time. And so we are doing a smaller dive, deeper dive into a particular area and providing that information to the people who care about this very small data [set]. And so we want to be able to reveal and make that data more transparent,” Lee says.
One of the strongest aspects of the website is the so-called ask Bill button, where users can request niche data points from various data sets. Erickson says that has led him down some interesting roads, including connecting him to one group with a community-based project.
“I know that some of the data I provided to someone actually helped them. They wanted to design an accessible playground for the community and get funding for it and they needed some numbers to back up [their plans by asking] how many kids with disabilities are there in this sort of this catchment area that would use the playground,” Erickson says, “I was able to provide them with that information so that they were able and they actually had successful fundraising and getting some grants and things.”
The site is a free and you can create a user account as well as joining their mailing list.
More DJA Coverage

A bipartisan committee in the U.S. House of Representatives is affirming the rights of Disabled people to live in...
By
September 30, 2026

Fear not — Section 504 is still the law. That's the message disability rights attorneys and advocates are stressing...
By
September 25, 2026

Every once in a while an overtly ableist article trounces its way into the social media discourse. Last year,...
By
September 24, 2026